Device Integration and Inspection
The core question in device integration and inspection is: first connect TDP, NDR, HIDS, EDR, firewalls, and other security devices in the enterprise to Flocks, then periodically confirm that they are online, their rule libraries are effective, logs have not stopped, and performance is normal.
Flocks uses Device Management to maintain the device inventory, API / web2cli capabilities, and device Skills. A device inspection sub-agent then performs read-only inspections; when anomalies are found, they are immediately sent through channels and recorded.
Scenario Overview
This scenario is easy to confuse with host inspection. The boundary is:
| Scenario | Object | Concern |
|---|---|---|
| Host Inspection / Incident Forensics | Business hosts, Linux / a small number of Windows machines | Has it been compromised? Is there mining / WebShell activity? |
| Device integration and inspection, this page | Security devices themselves, such as NDR / HIDS management consoles / firewalls / intelligence sources | Is the device connected? Is it operational? Is active defense functioning? |
In delivery projects, device inspection is one of the easier automation scenarios to deploy. Because all queries are read-only and do not involve host commands or human popups, it is suitable as a routine scheduled task.
Device Integration
When connecting devices, first refer to Device Management. Device Management corresponds to the Data Sources and Devices page in WebUI and maintains device basic information, connection status, API capabilities, web2cli actions, and device Skills.
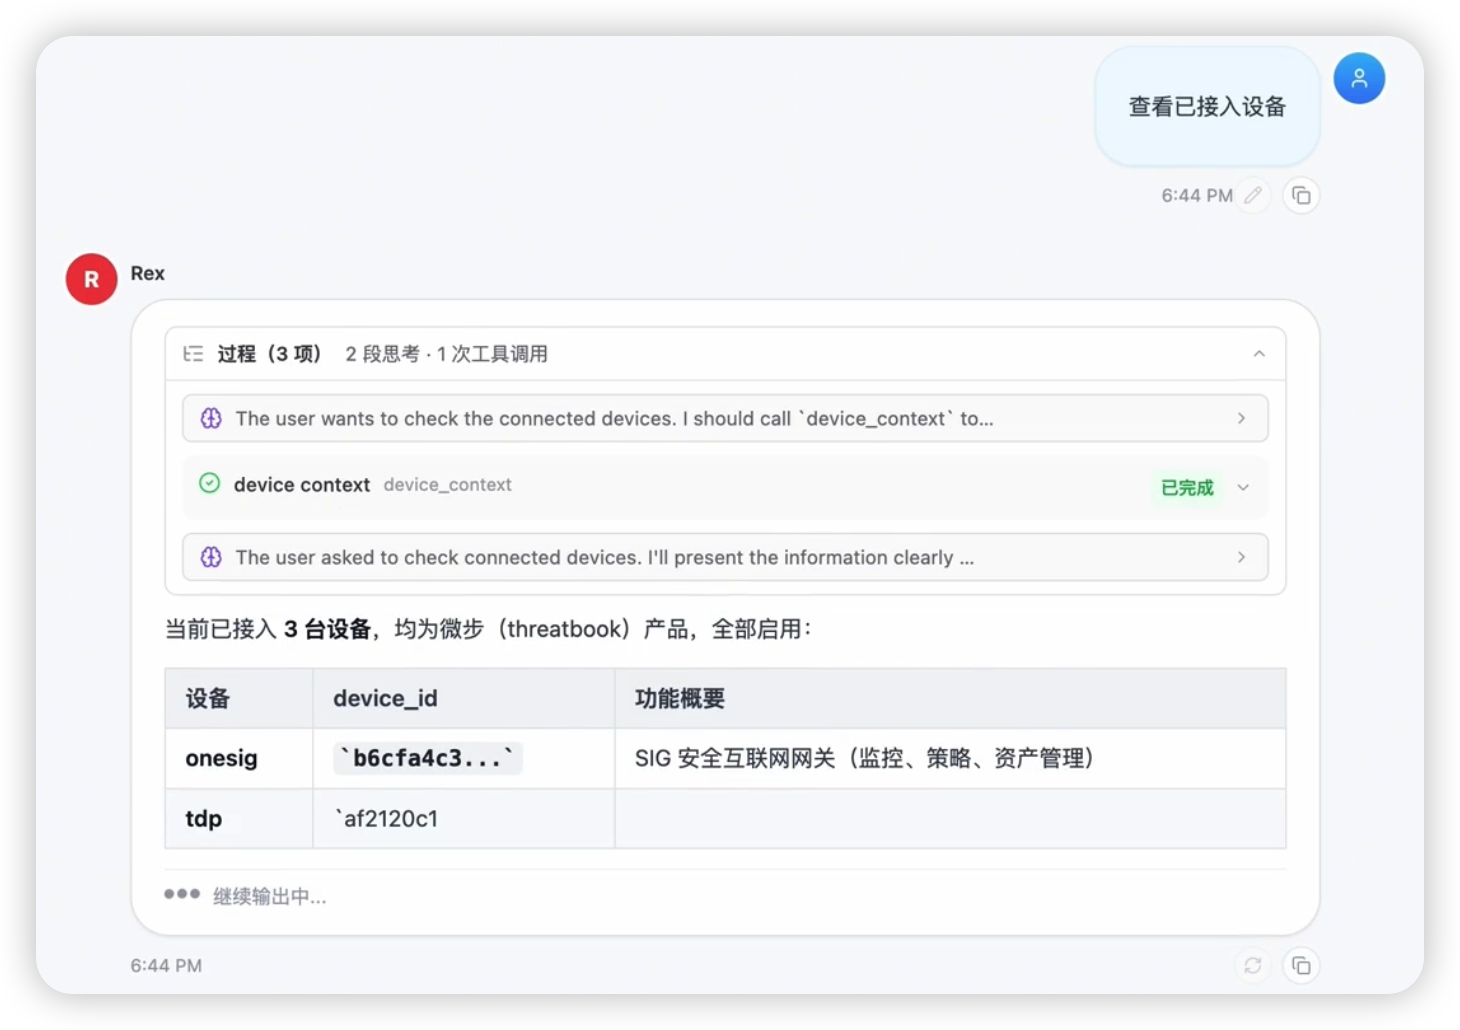
Typical integration path:
- In Data Sources and Devices, select a device type such as TDP, NDR, HIDS, SIEM, firewall, or threat intelligence source.
- Fill in endpoint, Token, AK/SK, Secret, or account credentials.
- Run a connection test to confirm network reachability, valid credentials, and fields that tools or Agents can consume.
- Choose capabilities based on device conditions: prefer API integration when the API is complete; add web2cli when only a Web console is available; capture stable inspection methods as device Skills.
- Bind Task Center or Workflow so the inspection process can run periodically.
Inspection Inputs and Outputs
Typical Inputs
- A device inventory, including IP / vendor / management API address / authentication information
- Inspection items, such as online status, rule library version, log status, CPU / memory / bandwidth
- An inspection frequency, usually once per hour
Typical Outputs
- Inspection snapshot: health matrix for each run, device x inspection item
- Anomaly list: newly detected anomalies in the current run, with the last normal time
- Channel notification: push to WeCom / DingTalk / Feishu immediately when anomalies appear
- Inspection ledger: long-term retention in Workspace for audit and review
Prerequisites
| Dependency | Requirement |
|---|---|
| Model | The default model is sufficient; inspection itself is not reasoning-heavy, and the model is mainly used for result summarization and anomaly judgment. See Model Configuration |
| Device integration | Security devices have been connected in Device Management and have API, web2cli, or device Skill capabilities |
| Channels | At least one of WeCom / DingTalk / Feishu is connected. See Messaging & Alerting Integrations |
| Task center | Used to drive hourly scheduled execution. See Task Center |
| Baseline thresholds | Recommended to write into a Skill in advance: online / offline criteria, rule library expiration days, performance thresholds |
Inspection Principle
Device inspection is executed by a dedicated sub-agent. Rex understands the goal, selects the device inspection sub-agent, and passes the device list, inspection items, and output requirements to it. The sub-agent calls device APIs, web2cli, file read/write, and channel tools in its own execution loop to fetch data, judge status, summarize, and notify.
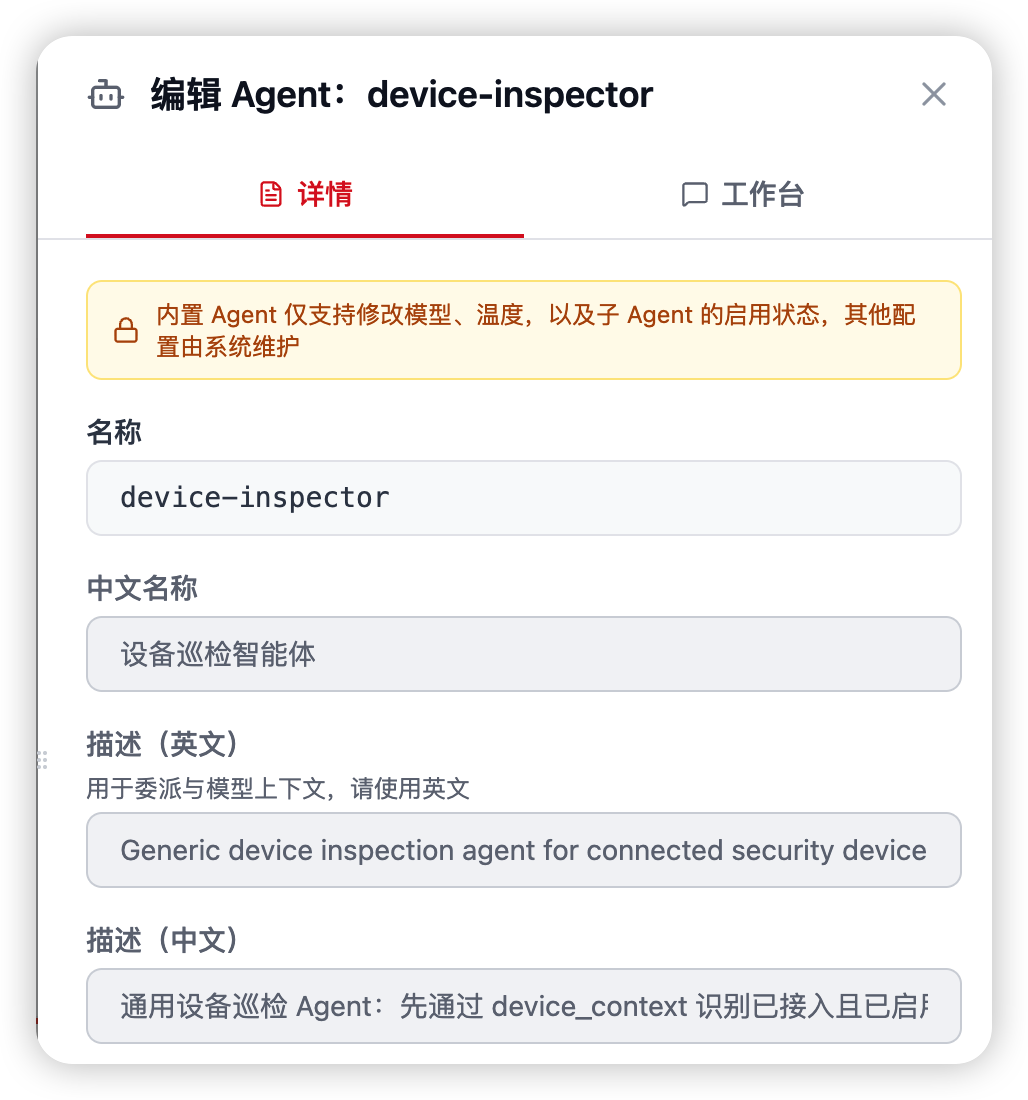
The benefit of this split is that Rex remains the unified entry point, while the device inspection sub-agent focuses on device health checks. For long-term reuse, only the sub-agent's tool permissions, prompt, inspection thresholds, and output format need to be maintained.
Steps (WebUI)
Step 1: Prepare the Connected Device Inventory and Inspection Items
Maintain a structured inventory in Workspace or a project Skill as input to the inspection Agent:
devices:
  - name: Core NDR
    vendor: ndr-a
    api_base: https://ndr.example.com
    checks: [online, rule_version, log_status, cpu, mem]
  - name: Primary Site Firewall
    vendor: fw-b
    api_base: https://fw.example.com
    checks: [online, rule_version, log_status, throughput]
This inventory can also come from Device Management, an enterprise CMDB, or an asset management platform, with the Agent calling an API to fetch it first.
Step 2: Start a Session and Run One Manual Inspection for Validation
Go to Session Management -> + New Session:
"Inspect all devices in the inventory according to the checklist. For each device, output whether it is online, rule library version, latest log time, CPU / memory usage, and finally summarize a health table."
Run it once first to:
- Verify that API tools for each device work
- Check that model output structure meets expectations
- Let Rex iterate the structure in the same session if needed
Step 3: Structure Results + Judge Anomalies
Rex summarizes query results for each device into a table and performs anomaly judgment:
- Online: API returns within the time limit -> healthy
- Rule library version: compare with the preset "oldest acceptable date"; older than that is abnormal
- Log status: latest log older than the threshold -> log interruption
- Performance: CPU / memory / bandwidth exceeds threshold -> abnormal
All raw data and summary results are persisted to Workspace, such as inspection/YYYY-MM-DD/HH.json, for later comparison.
Step 4: Channel Notification for Anomalies
When anomalies appear, Rex automatically calls the channel tool and sends a summary:
"This run found 2 abnormal devices: core NDR rule library has not been updated for more than 30 days; main-site firewall CPU remains above 95%."
The copy template can be written into a Skill to make notifications more controllable.
Step 5: Convert to an Hourly Scheduled Task
Continue in the same session and tell Rex:
"Turn this inspection process into a scheduled task. Run it every hour, send to WeCom only when anomalies appear, and stay quiet when everything is normal."
Rex creates a task in Task Center:
- Trigger: run once per hour
- Task description: reuse the natural-language description from this session
channel:wecom/dingtalk/feishuSession ID: specified session- Quiet policy: do not send if everything is normal, reducing channel noise
Real Case Walkthrough: Routine Inspection for a Government Cloud Scenario
A typical enterprise routine inspection process:
| Time | Inspection Agent action | Output / notes |
|---|---|---|
| T+0:00 | Scheduled task triggers; Agent pulls the device inventory | Inventory can come from a built-in Skill or CMDB API |
| T+0:01 | Concurrently calls APIs for each device | Online status / rule library version / log time / performance metrics |
| T+0:02 | Writes summary results to inspection/2026-03-28/14.json | Current snapshot persisted |
| T+0:03 | Compares with the previous snapshot and identifies newly appearing anomalies | Avoids repeated alerts |
| T+0:03 | No anomaly -> quiet; anomaly -> push WeCom summary | Reduces channel noise |
| T+0:04 | Writes inspection ledger for weekly review | Can be used for SLA audit |
| T+1:00 | Next run triggers automatically | 7 x 24 operation |
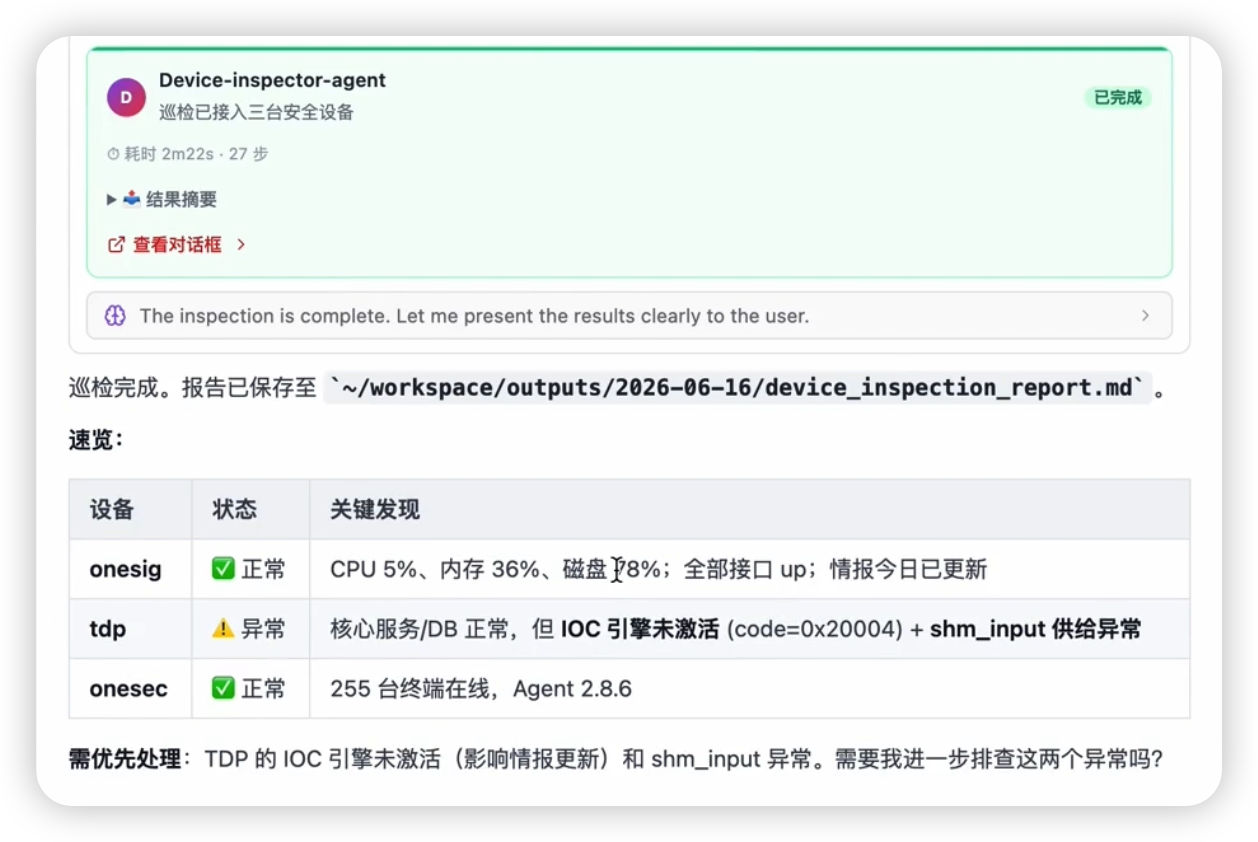
A TDP + OneSec device inspection case usually splits results into two report types:
- TDP Inspection: outputs machine count, key metrics, feature status, system runtime status, component status, CPU usage, and whether services are unavailable or resource usage is abnormal.
- OneSec Inspection: outputs connected device count, online / offline status, threat behaviors, threat event list, health assessment, and data collection notes, making it easier to determine whether the device is still continuously producing logs and detection results.
Output Example
A typical inspection snapshot for one run:
{
  "timestamp": "2026-03-28T14:00:00+08:00",
  "summary": {
    "total": 12,
    "healthy": 10,
    "abnormal": 2
  },
  "devices": [
    {
      "name": "Core NDR",
      "online": true,
      "rule_version": "2026-02-15",
      "rule_age_days": 41,
      "log_last_ts": "2026-03-28T13:58:12+08:00",
      "cpu": 42,
      "mem": 61,
      "abnormal": ["rule_outdated"]
    },
    {
      "name": "Primary Site Firewall",
      "online": true,
      "cpu": 96,
      "mem": 82,
      "throughput_mbps": 880,
      "abnormal": ["cpu_high"]
    }
  ]
}
Channel push copy, shown schematically:
[Device Inspection 14:00] 2 anomalies found
- Core NDR: rule library has not been updated for 41 days (baseline: 30 days)
- Main-site firewall: CPU 96%, sustained for 15 minutes
The other 10 devices are healthy. See Workspace inspection/2026-03-28/14.json for details.
Continuous Operation and Scheduled Tasks
| Task form | Description |
|---|---|
| Hourly full inspection | Core use case and recommended first deployment for enterprises |
| Nightly deep inspection | Run additional checks every day at 02:00, such as configuration diff, license expiration, and certificate expiration |
| Weekly report aggregation | Generate a weekly health trend chart from the ledger every Monday at 09:00 and push to IM |
| Alert linkage | When a device is abnormal, notify the business Owner that depends on the device nearby, not only the security group |
Boundaries and FAQ
| Question | Handling |
|---|---|
| A vendor only provides a Web console and no API | Add web2cli actions in device management, and if needed enable the browser tool to log into the console and fetch data; once stable backend interfaces are found, capture them as API tools |
| Channel noise is high and messages are sent every hour | Add a quiet policy: send only for "new anomalies" or "persistent anomalies over N rounds" |
| Too many devices overload interfaces with concurrency | Add concurrency limits at the tool layer, or split the inventory into two groups and run them alternately |
| Rule library version fields differ by vendor | Write a "normalization adapter" in each device Skill to output unified rule_version / rule_age_days |
| Want the Agent to automatically restart devices | Not recommended. Flocks only performs inspection + alerting; restart actions should still be executed manually by operations |
Related Resources: Scenario Overview · Device Management · Host Inspection / Incident Forensics · Task Center · Skills · Messaging & Alerting Integrations